
Flow Analytics
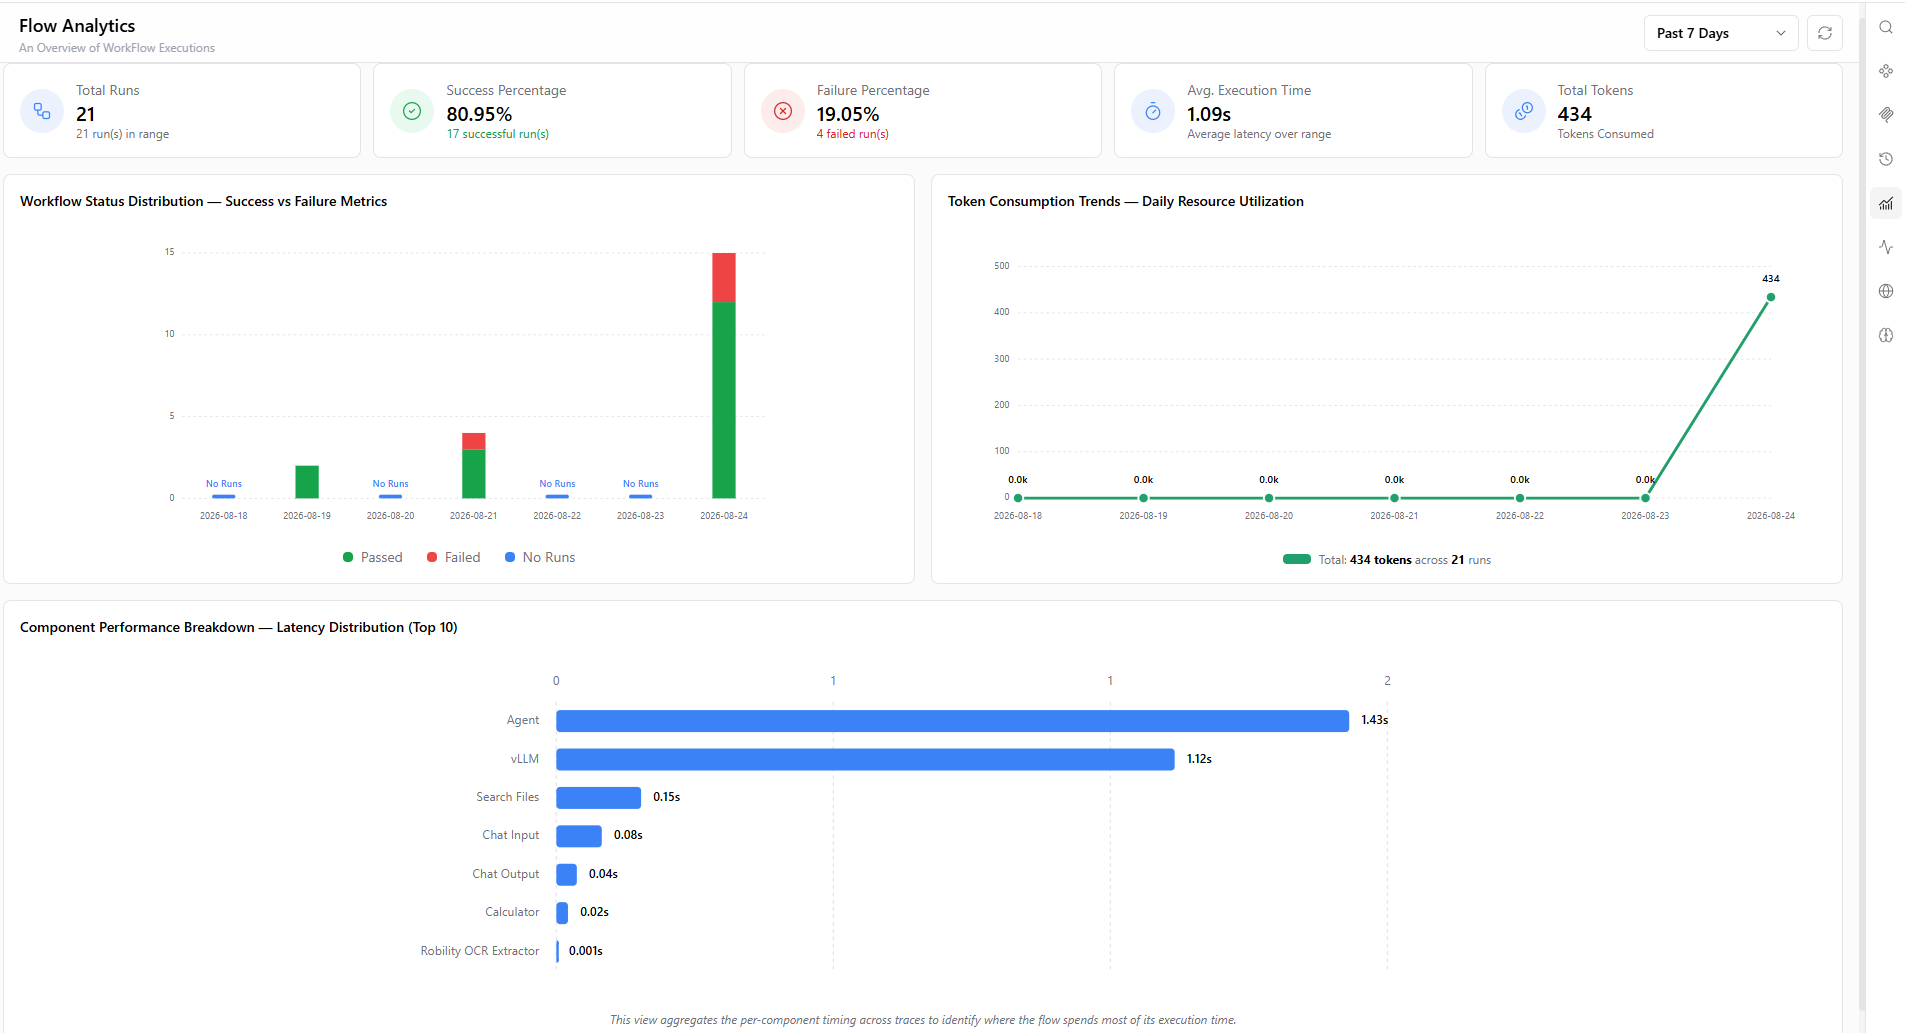
The Flow Analytics Dashboard provides real-time visibility into workflow reliability, execution speed, resource utilization, and component efficiency. Use it to isolate performance bottlenecks, monitor failure patterns, and track model token consumption.
Quick Actions
1. Filter by Timeframe: Use the date selector in the upper-right corner to analyze activity for Today, Yesterday, or the Past 3, 5, or 7 Days.
2. Refresh Data: Click the Refresh icon next to the timeframe selector to manually update the dashboard with the latest execution metrics.
Core Value & Use Cases
1. Monitor Reliability: Track execution volumes and success vs. failure rates. Instantly spot failure spikes and jump directly into execution logs.
2. Identify Bottlenecks: Analyze latency across specific workflow components—such as Agent, vLLM, and Search Files—to pinpoint steps causing execution delays.
3. Optimize Costs: Track token consumption trends over time to forecast model utilization, manage operational budgets, and prevent overages.
Key Performance Indicators
| Metric | Definition |
|---|---|
| Total Runs | Total workflow executions completed within the selected timeframe. |
| Success Percentage | Percentage of workflow runs completed successfully without errors. |
| Failure Percentage | Percentage of workflow runs that failed due to runtime or tool execution errors. |
| Avg. Execution Time | Average time required for a workflow to complete from start to finish. |
| Total Tokens | Cumulative number of LLM tokens consumed across all executions within the selected timeframe. |
Charts & Visualizations
| Chart Name | Description & Focus | Visual Indicators |
|---|---|---|
|
Workflow Status Distribution (Success vs. Failure Metrics) |
Tracks daily execution volumes, failure spikes, and activity levels over time.
Note: Clicking any green or red bar opens the traces for those specific runs. |
🟢 Passed: Successful runs 🔴 Failed: Failed runs 🔵 No Runs: Days with zero activity |
|
Token Consumption Trends (Daily Resource Utilization) |
Maps total token usage across execution dates to highlight consumption spikes and support cost forecasting. | 🟢 Green Line: Total daily token volume |
|
Component Performance Breakdown (Latency Distribution - Top 10) |
Ranks workflow components by latency (for example, Agent, vLLM, and Search Files) based on aggregated trace timing. | 🔵 Horizontal Bar: Execution latency (seconds) |
Troubleshooting Common Scenarios
Scenario 1: High Failure Percentage
Locate Issue: Check the Workflow Status Distribution stacked bar chart and hover over red segments to pinpoint affected dates.
1. Investigate Logs: Click the red bar or open execution logs corresponding to those dates to analyze failure details and stack traces.
2. Common Root Causes:
a. Tool or integration execution errors.
b. Invalid or malformed input payloads.
c. Third-party service interruptions or workflow configuration mistakes.
Scenario 2: High Average Execution Time
Locate Issue: Review the Component Performance Breakdown chart to identify which component accounts for the highest latency.
1. Investigate Nodes: Trace the individual workflow nodes attached to the high-latency step (e.g., model inference or file indexing).
2. Common Root Causes:
a. Slow model inference response times (e.g., vLLM).
b. Heavy document search or unoptimized file retrieval operations.
c. Delays from external tool calls or network requests.
